Mission Control: Wind Speed Trend Analysis for Low Orbit Launch
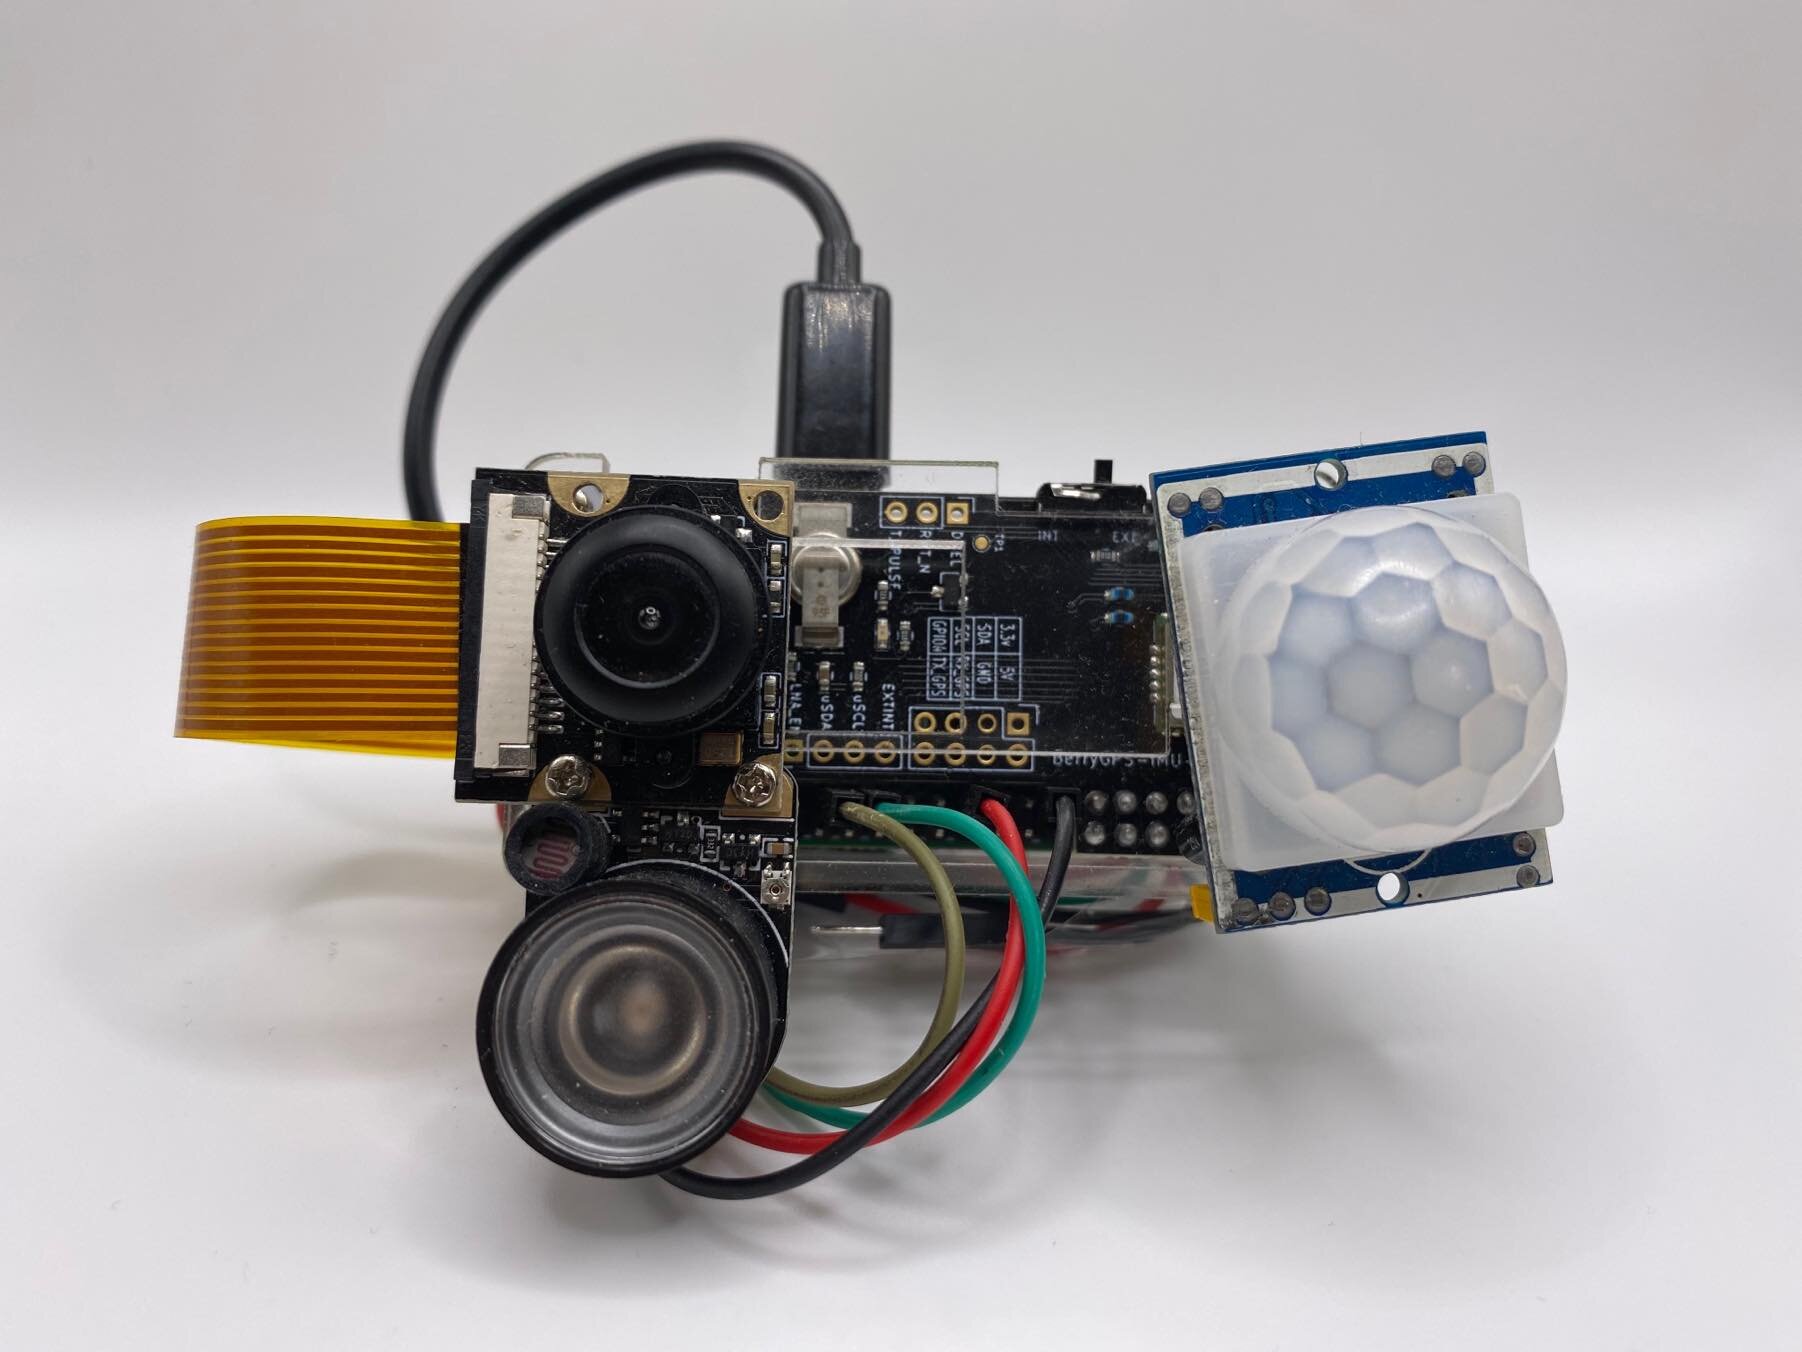
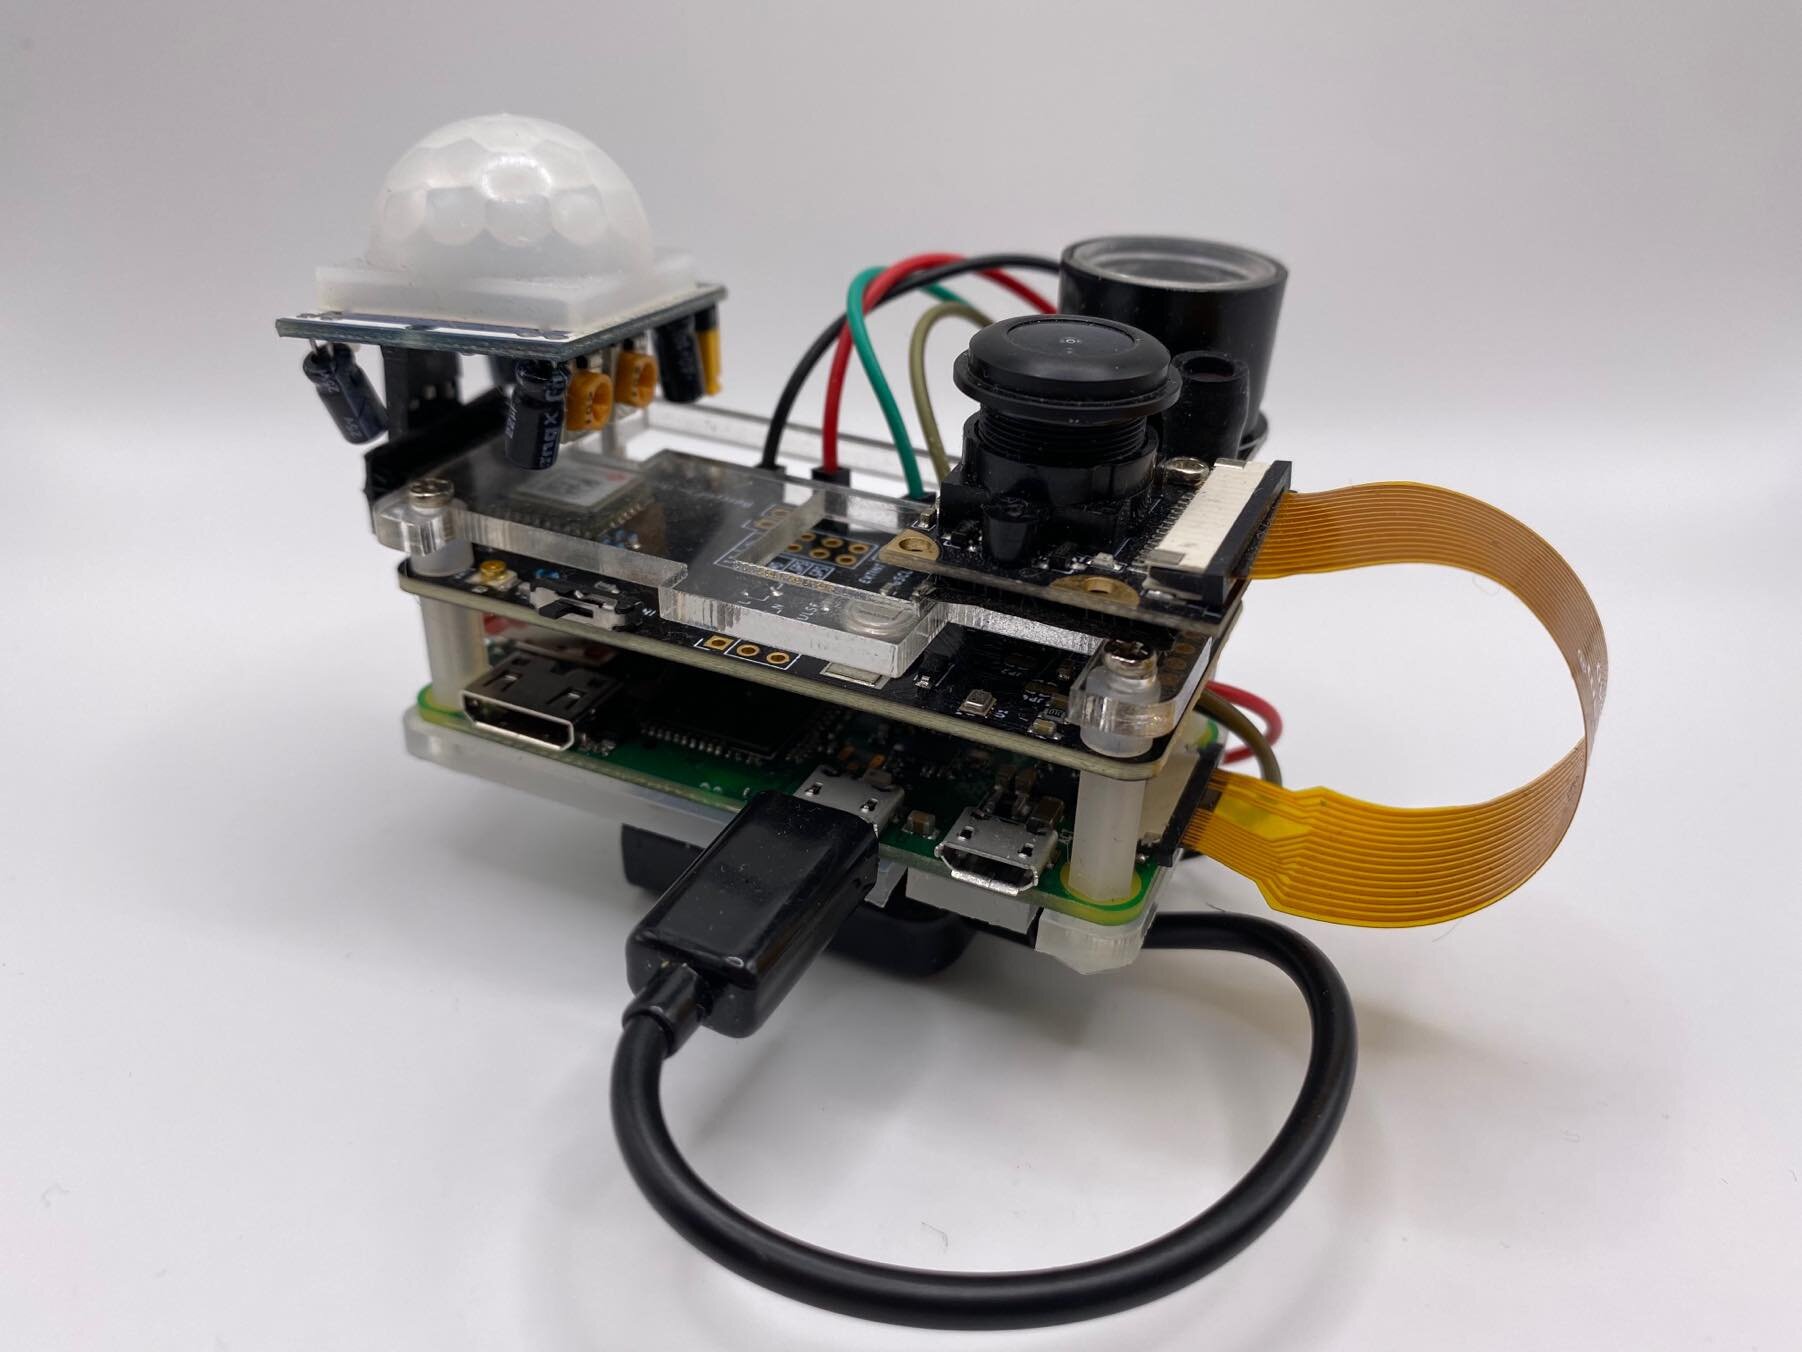
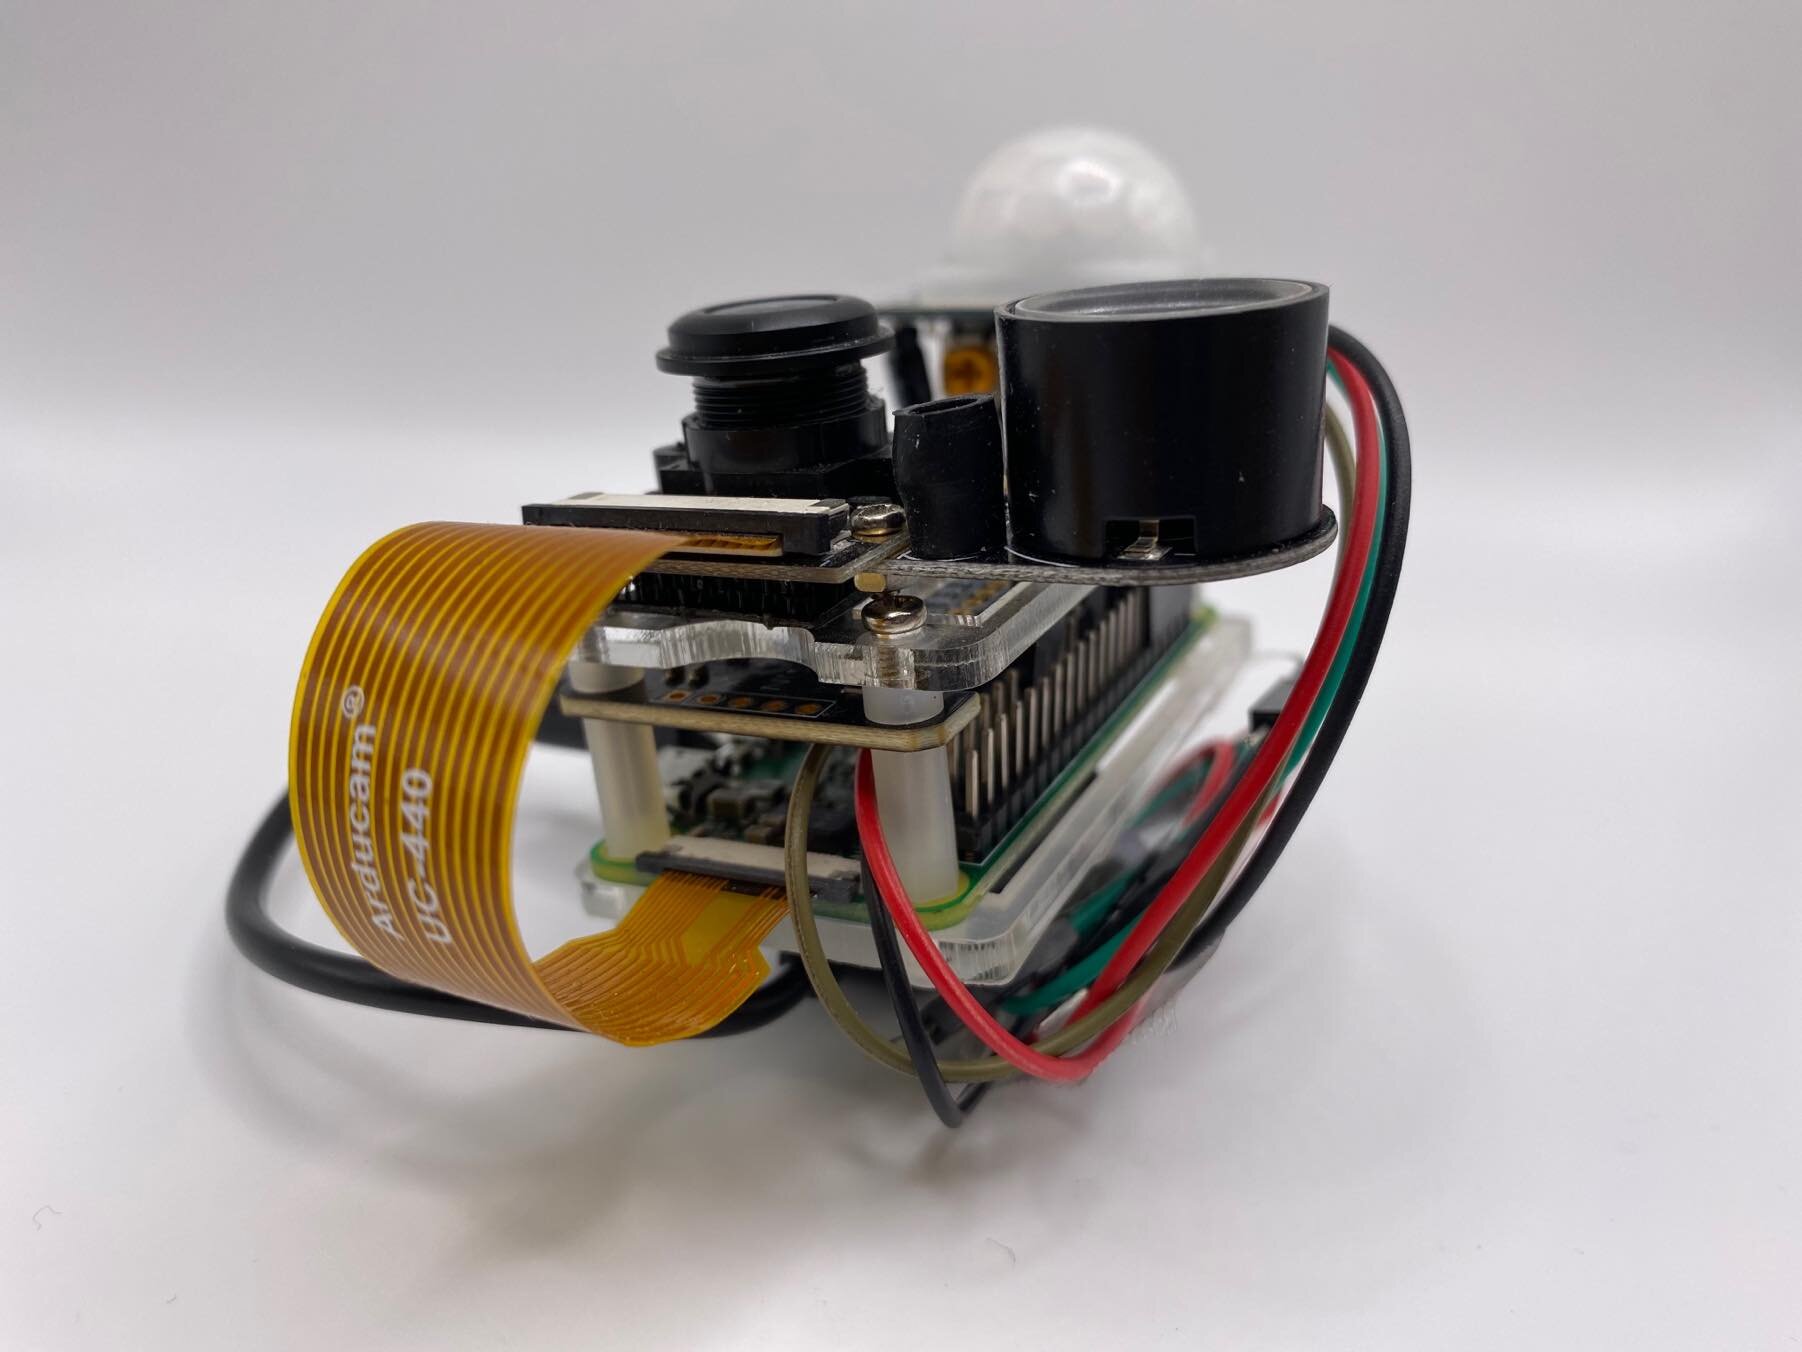
My thesis project for my python data science class entails a weather balloon launching up to space in order for it to drop its payload into orbit and back. The payload includes: GPS, motion/light sensors, camera, a Raspberry Pi board, and an external battery. In order to have a successful launch and accurate return, a lot of calculations and reports must be done. This is one of many reports to be had for a safe launch.
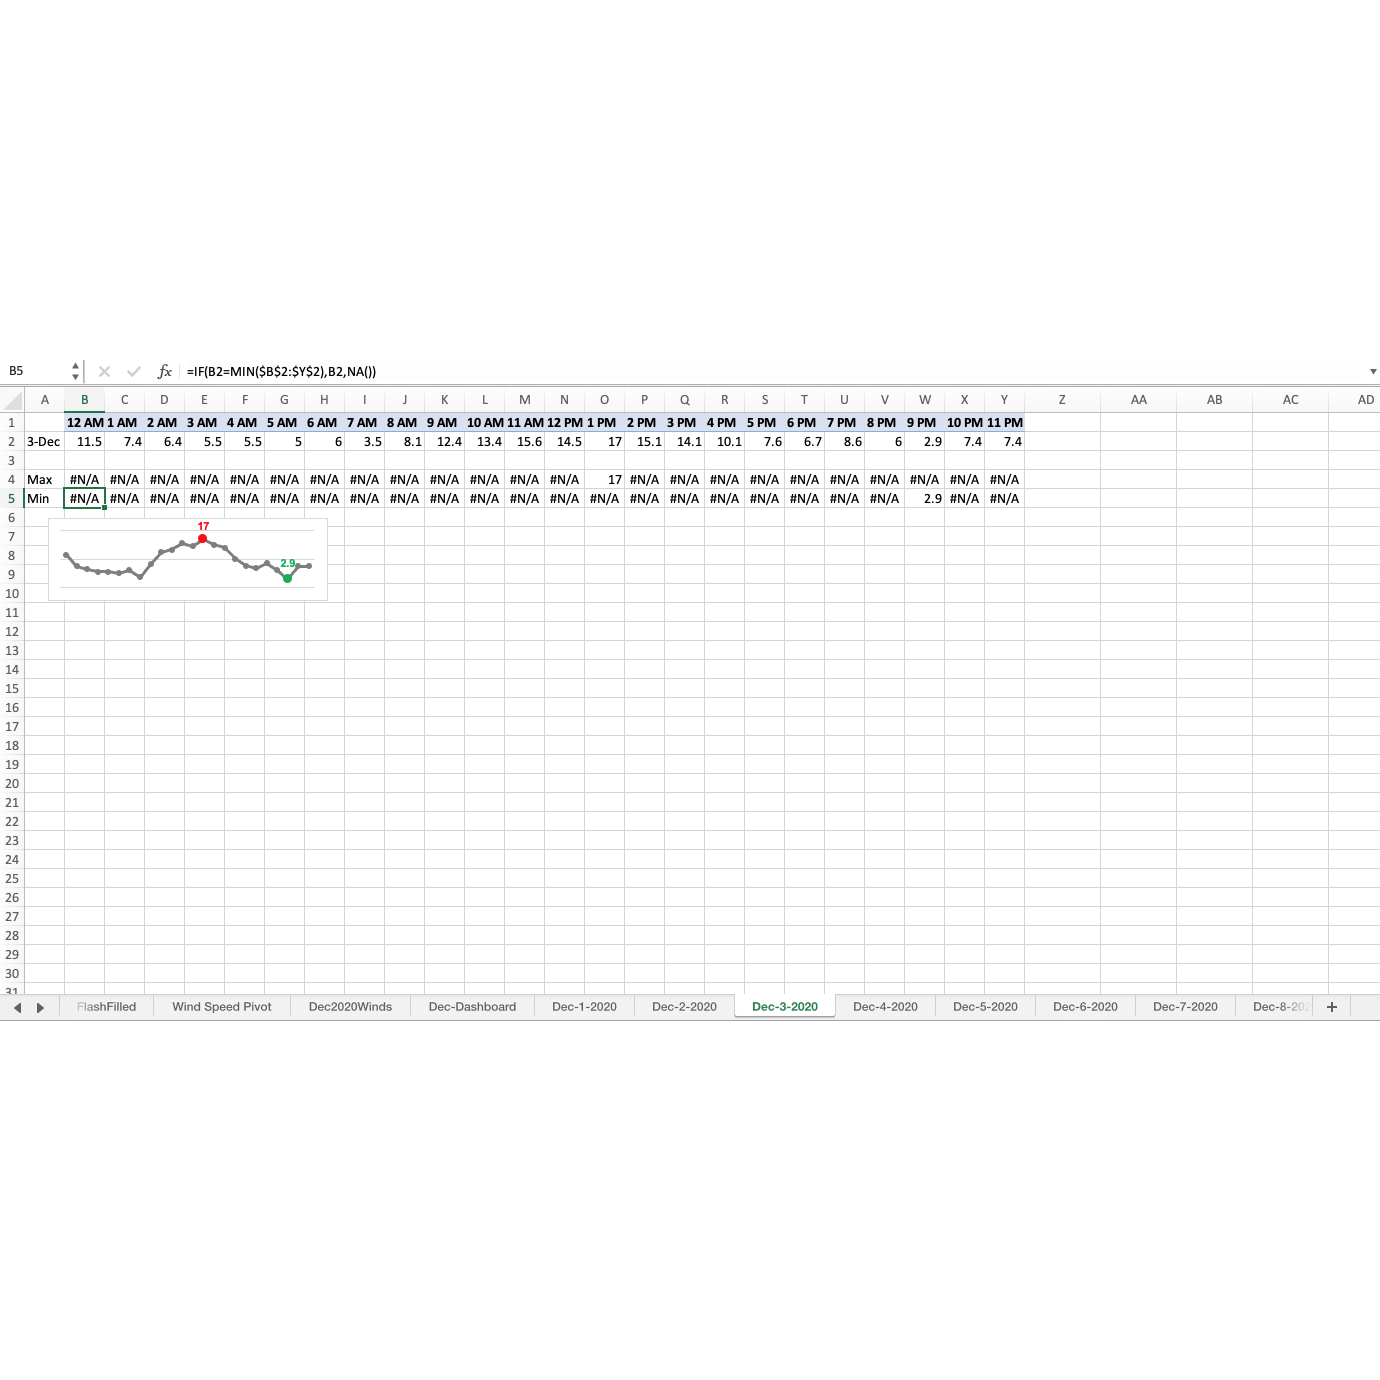
Low wind speeds are crucial for a successful ascent for a delicate balloon that can safely ride the winds of no more than 11-12mph.
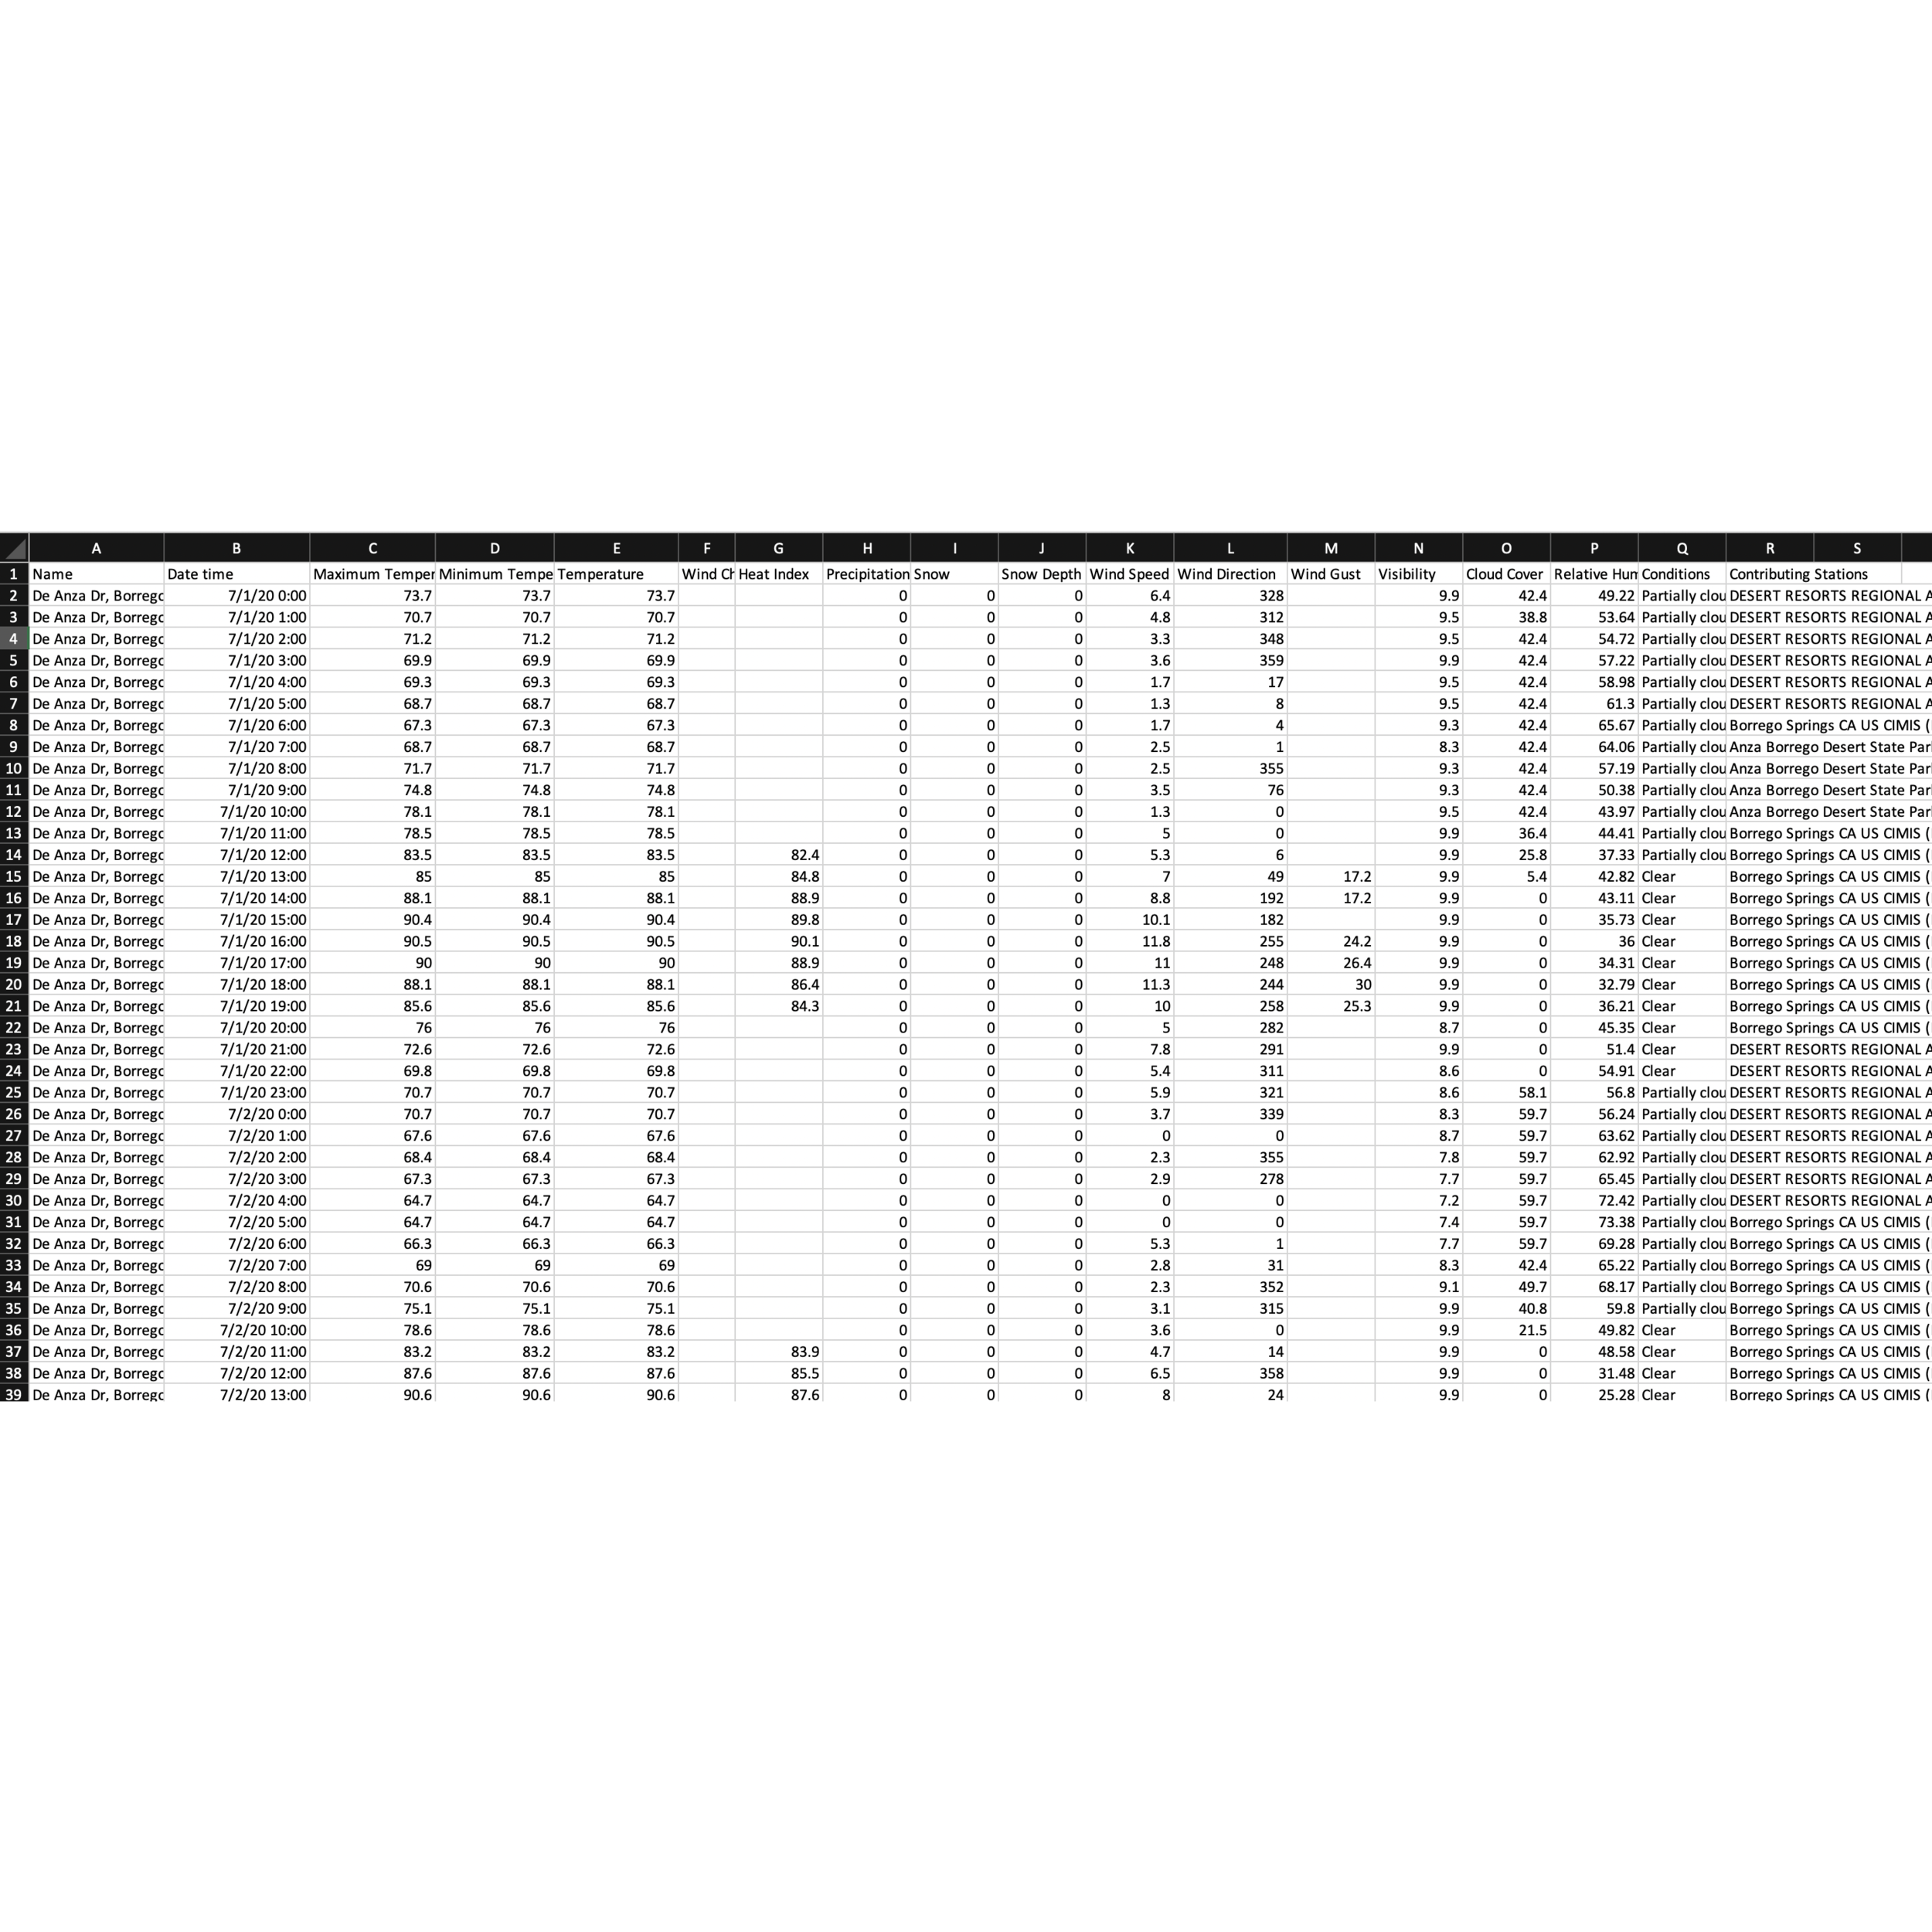
This report created in Excel, shows daily safe and unsafe wind speed trends per season/month between July 2020 - Dec 2020. According to the trends shown on the final report, the golden hours of a safer weather balloon launch is between 1:00AM - 8:00AM (more or less) depending on the season.
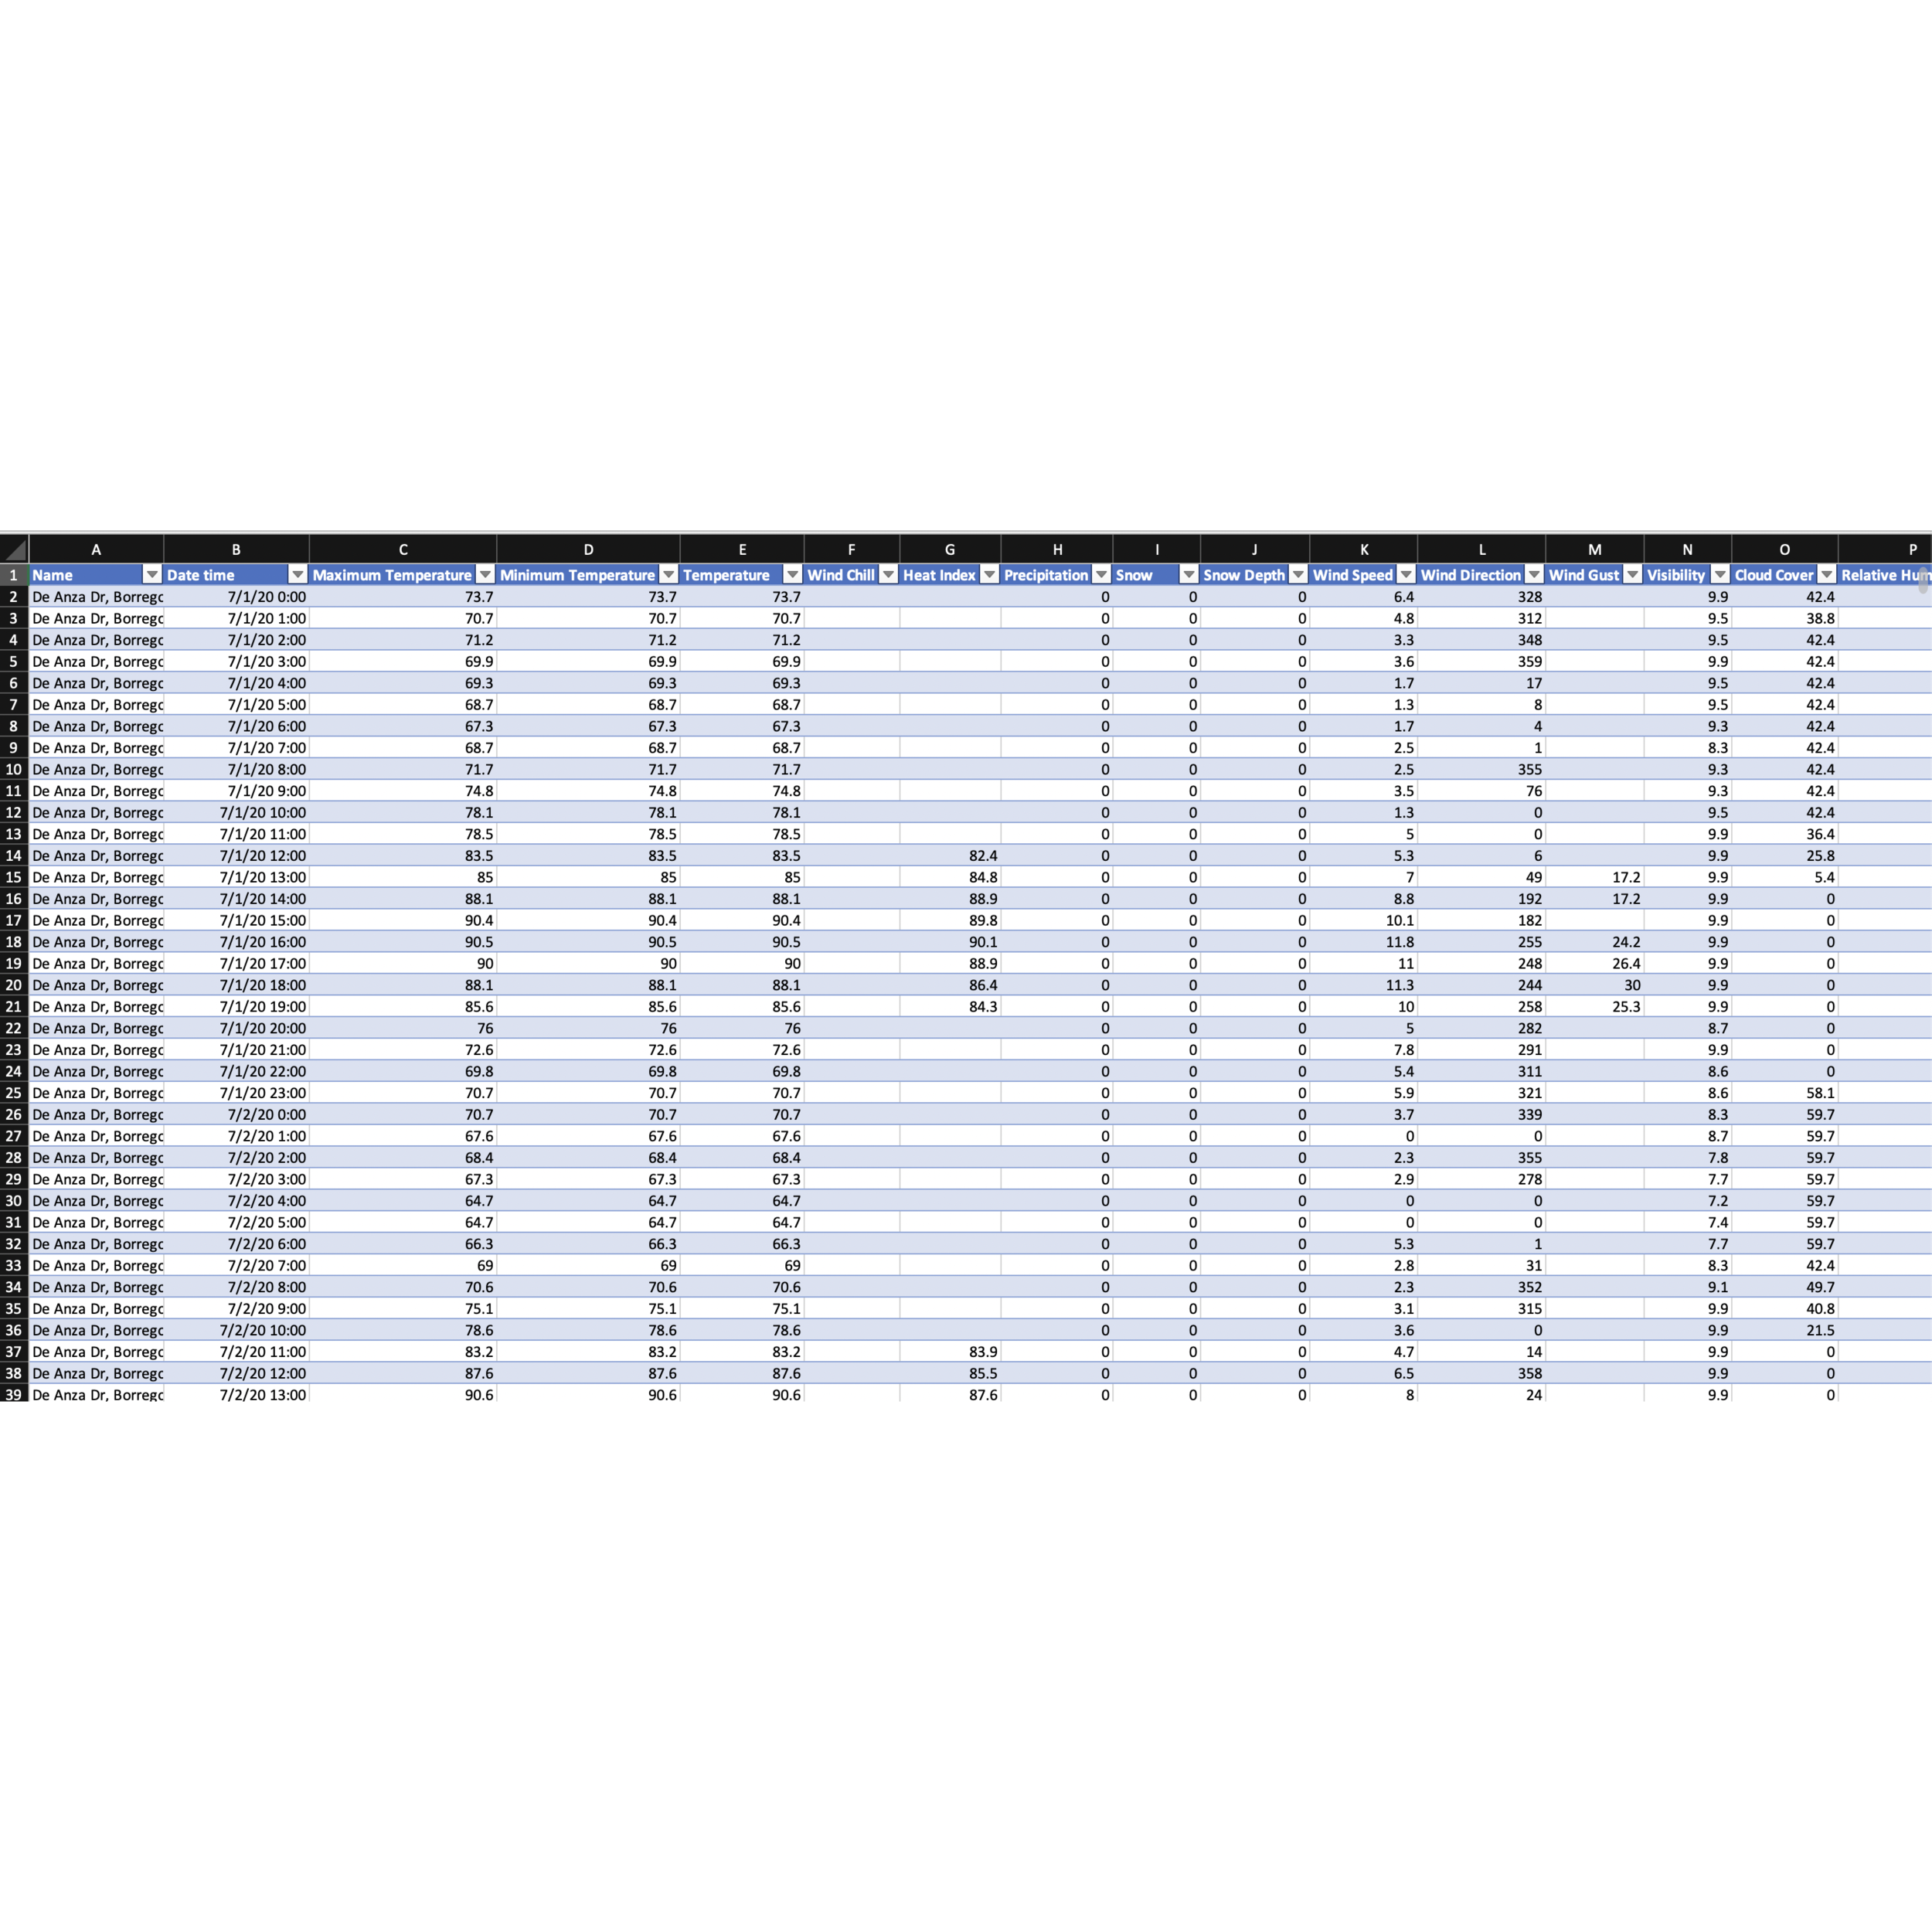
Below showcases a map of the operating area, images of the current assembled payload, and the process of the report: original data sets, organization, pivot tables, min/max formulated graphs, filters, numerous sheets, and the final wind speed trend report.
Data locations: Desert Resorts Regional Airport, CA & Anza Borrego Desert State Park CA
Data acquired from Visual Crossing https://www.visualcrossing.com/